From validated sample preservation to peer-reviewed bioinformatics, here’s how Microba Microbiome Explorer turns raw metagenomic data into clinically useful gut health insights.
The gut microbiome
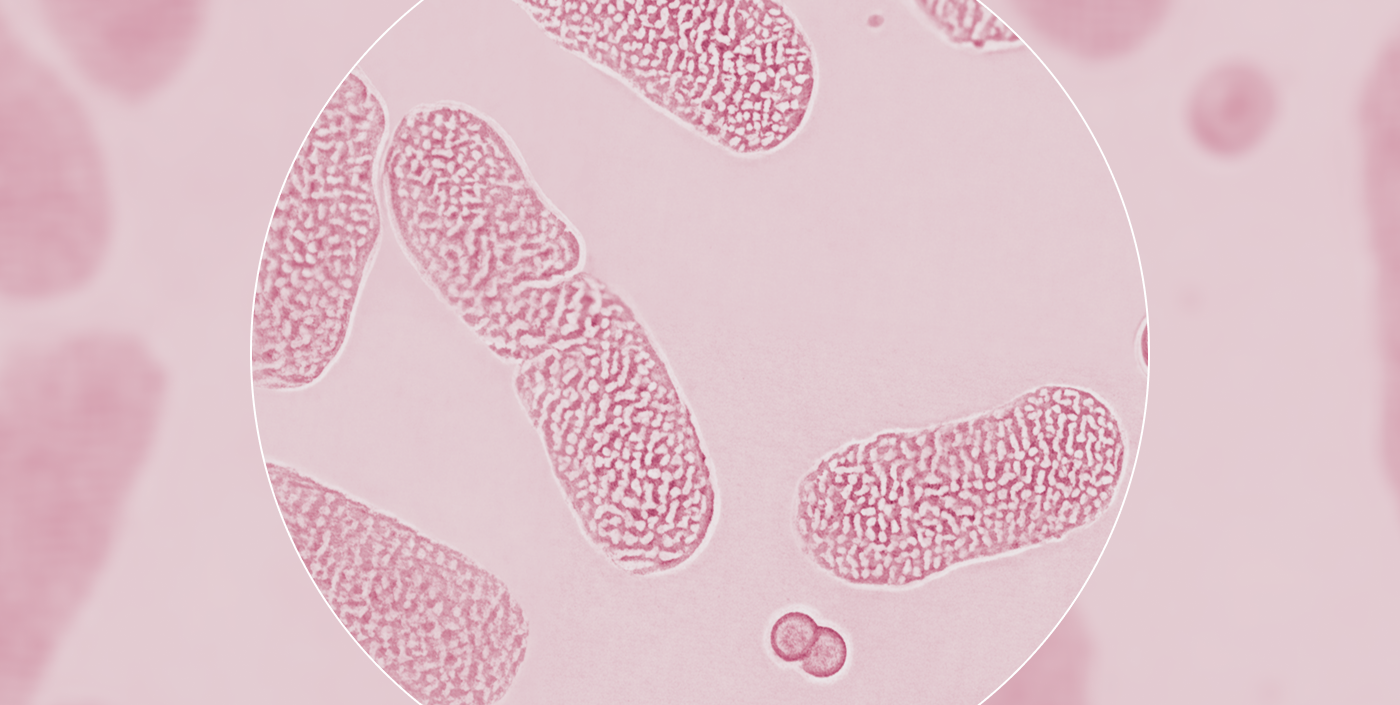
The human gut harbours trillions of microorganisms whose collective genome — the microbiome — encodes metabolic capabilities far exceeding those of the human genome alone.1 Over the past two decades, large-scale sequencing studies have demonstrated that the composition and function of this microbial community are associated with a wide range of health outcomes.2,3 Disruption of a healthy gut microbiome, often called dysbiosis, has been linked to gastrointestinal disorders, autoimmune conditions, cardiometabolic diseases, and neurological conditions.4
Microba Microbiome Explorer
The quality of a result comes from everything behind it
Microba Microbiome Explorer combines accredited gastrointestinal diagnostics with high-resolution shotgun metagenomic microbiome profiling. Pathogen detection and gastrointestinal markers are CE-certified and run within an ISO 15189 NATA-accredited medical laboratory. This overview covers the complete scientific and technological foundation — from how a sample is preserved, through to the clinical insights a practitioner reads in the report.

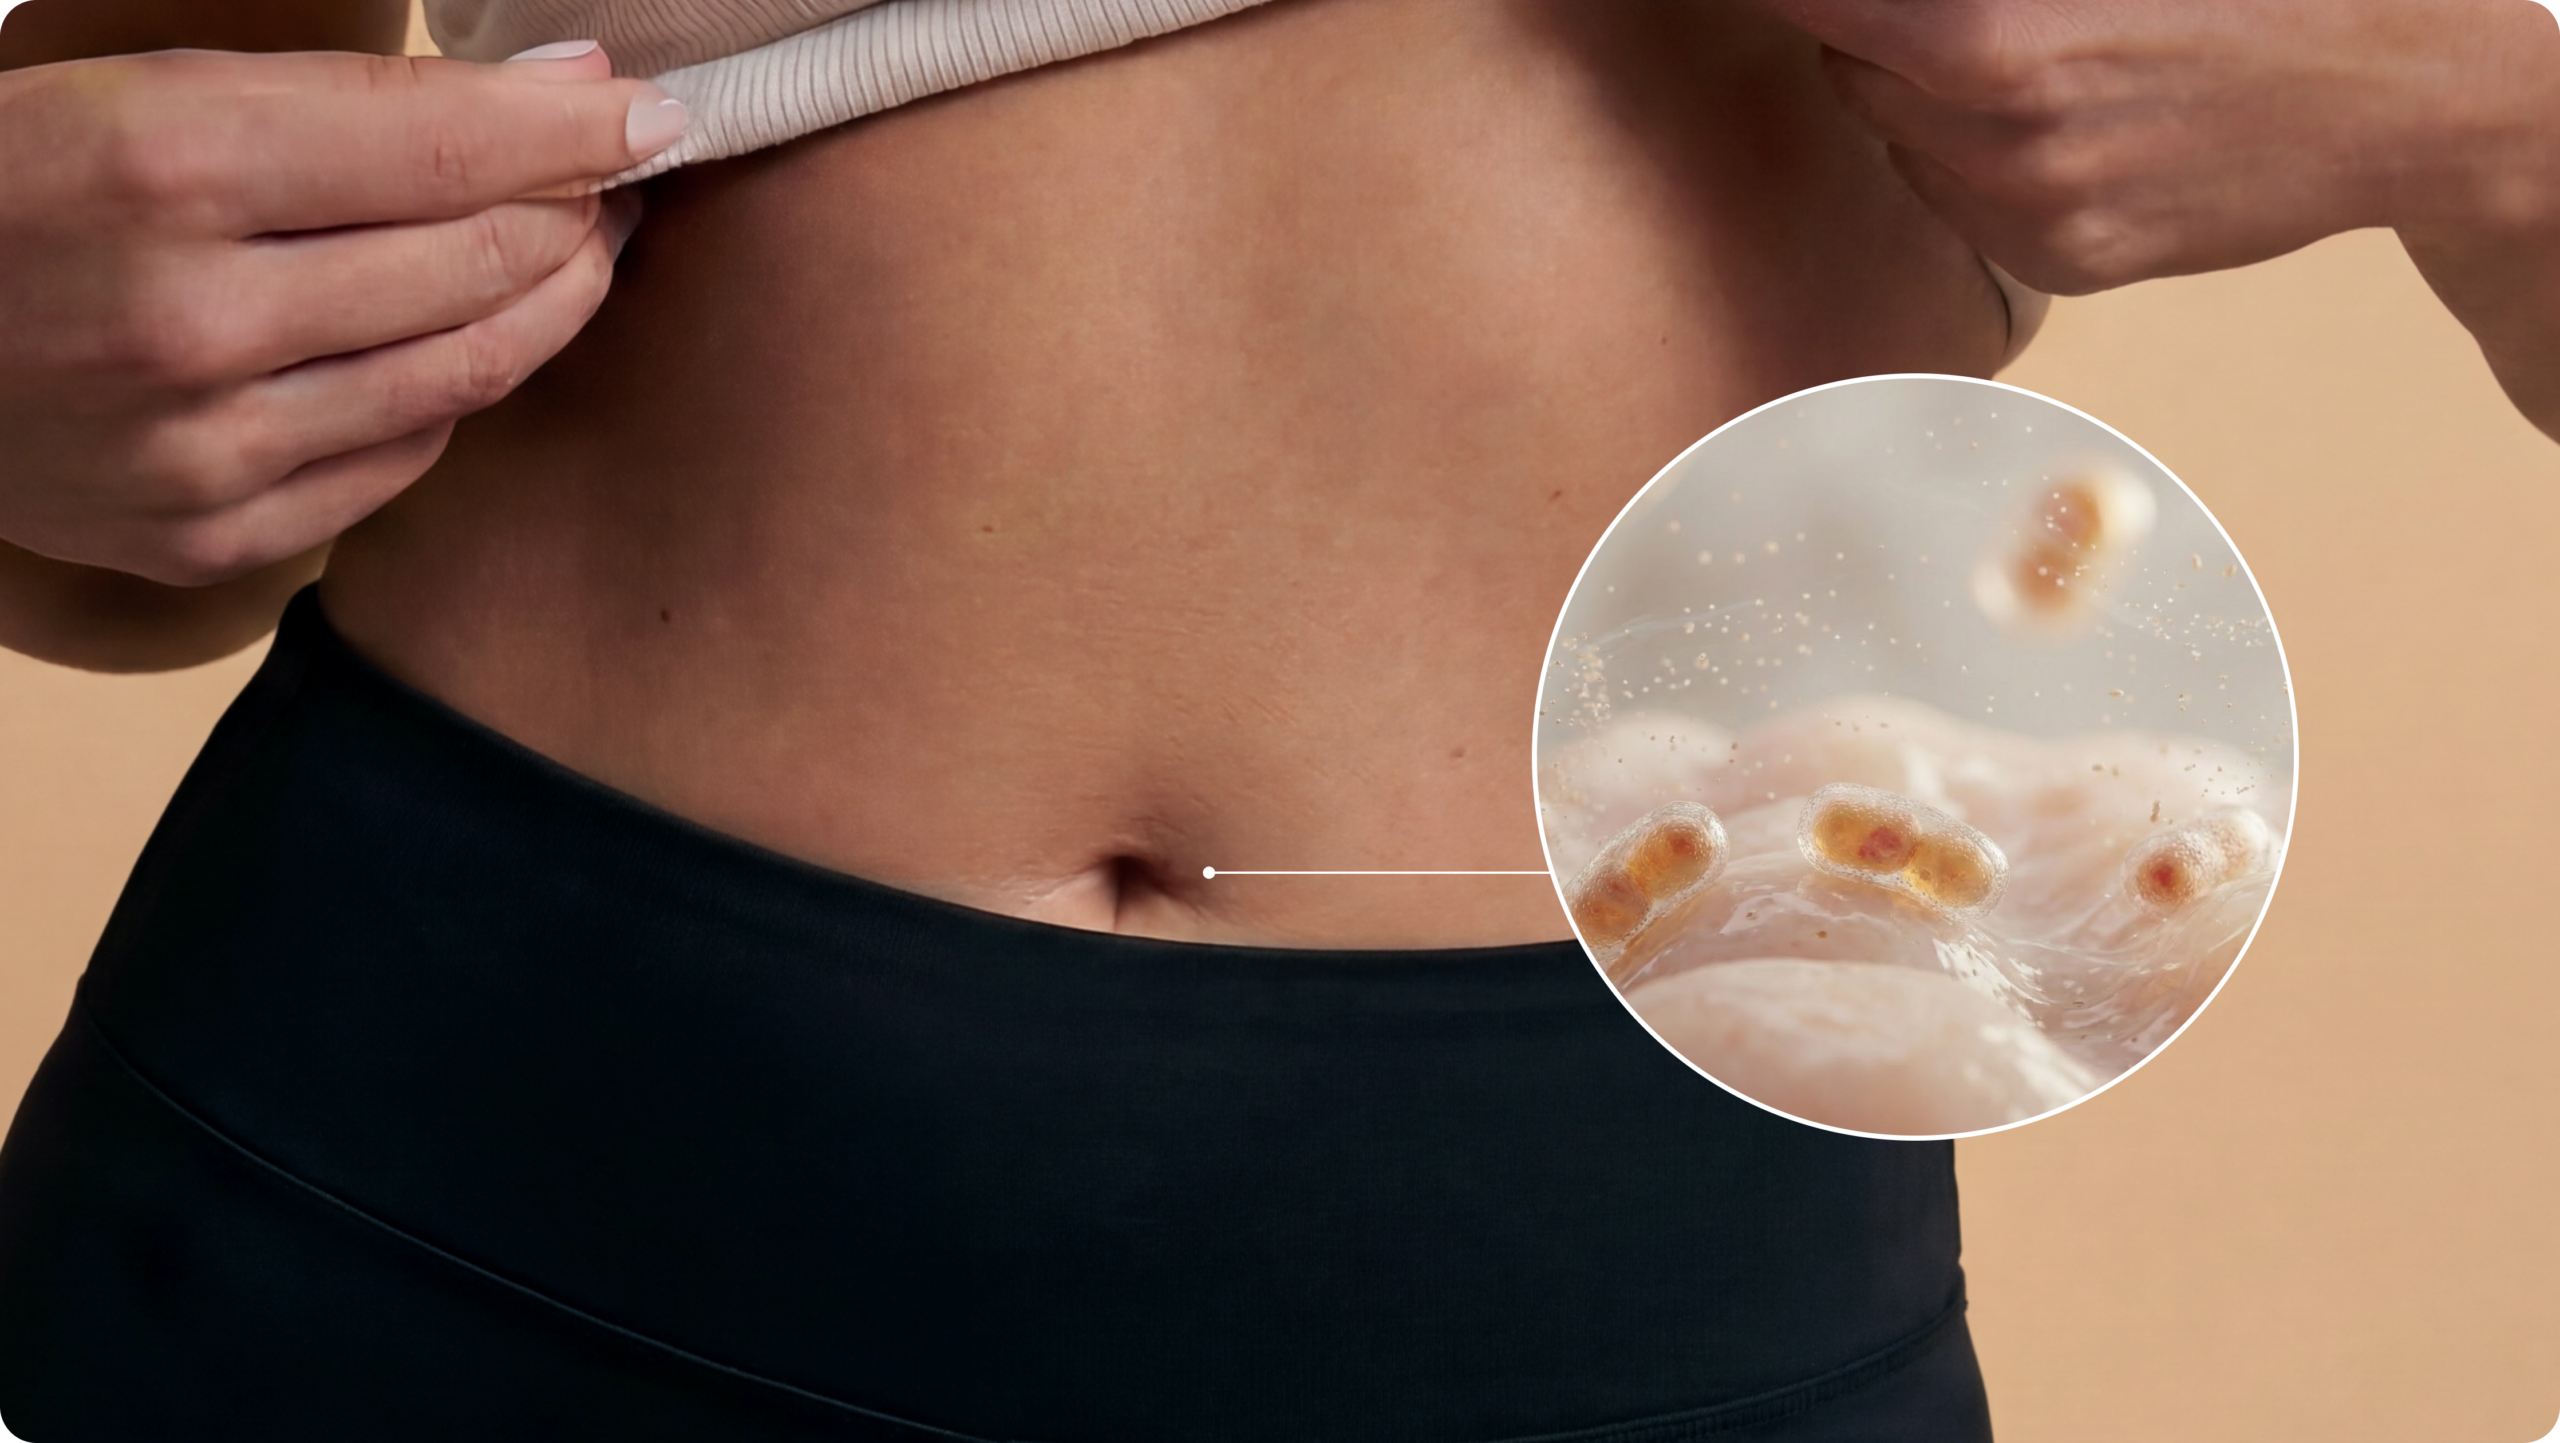
Validated sample preservation protects the accuracy of every result
The moment a sample is collected, the clock starts. Microbial composition shifts fast if preservation isn’t handled correctly — and most collection methods weren’t designed with that in mind.
Microba’s FLOQSwab-ADT was benchmarked head-to-head against the most widely used alternatives.6 It came out on top. Practitioners can be confident the sample that leaves the patient’s home is the sample that gets analysed. No degradation. No compromise.
Best reproducibility
Highest technical (between-replicate) reproducibility and compositional stability relative to flash-frozen controls in a peer-reviewed evaluation
Climate resilient
Stable across −20°C, room temperature, and 50°C for four weeks — suitable for postal collection Australia- wide
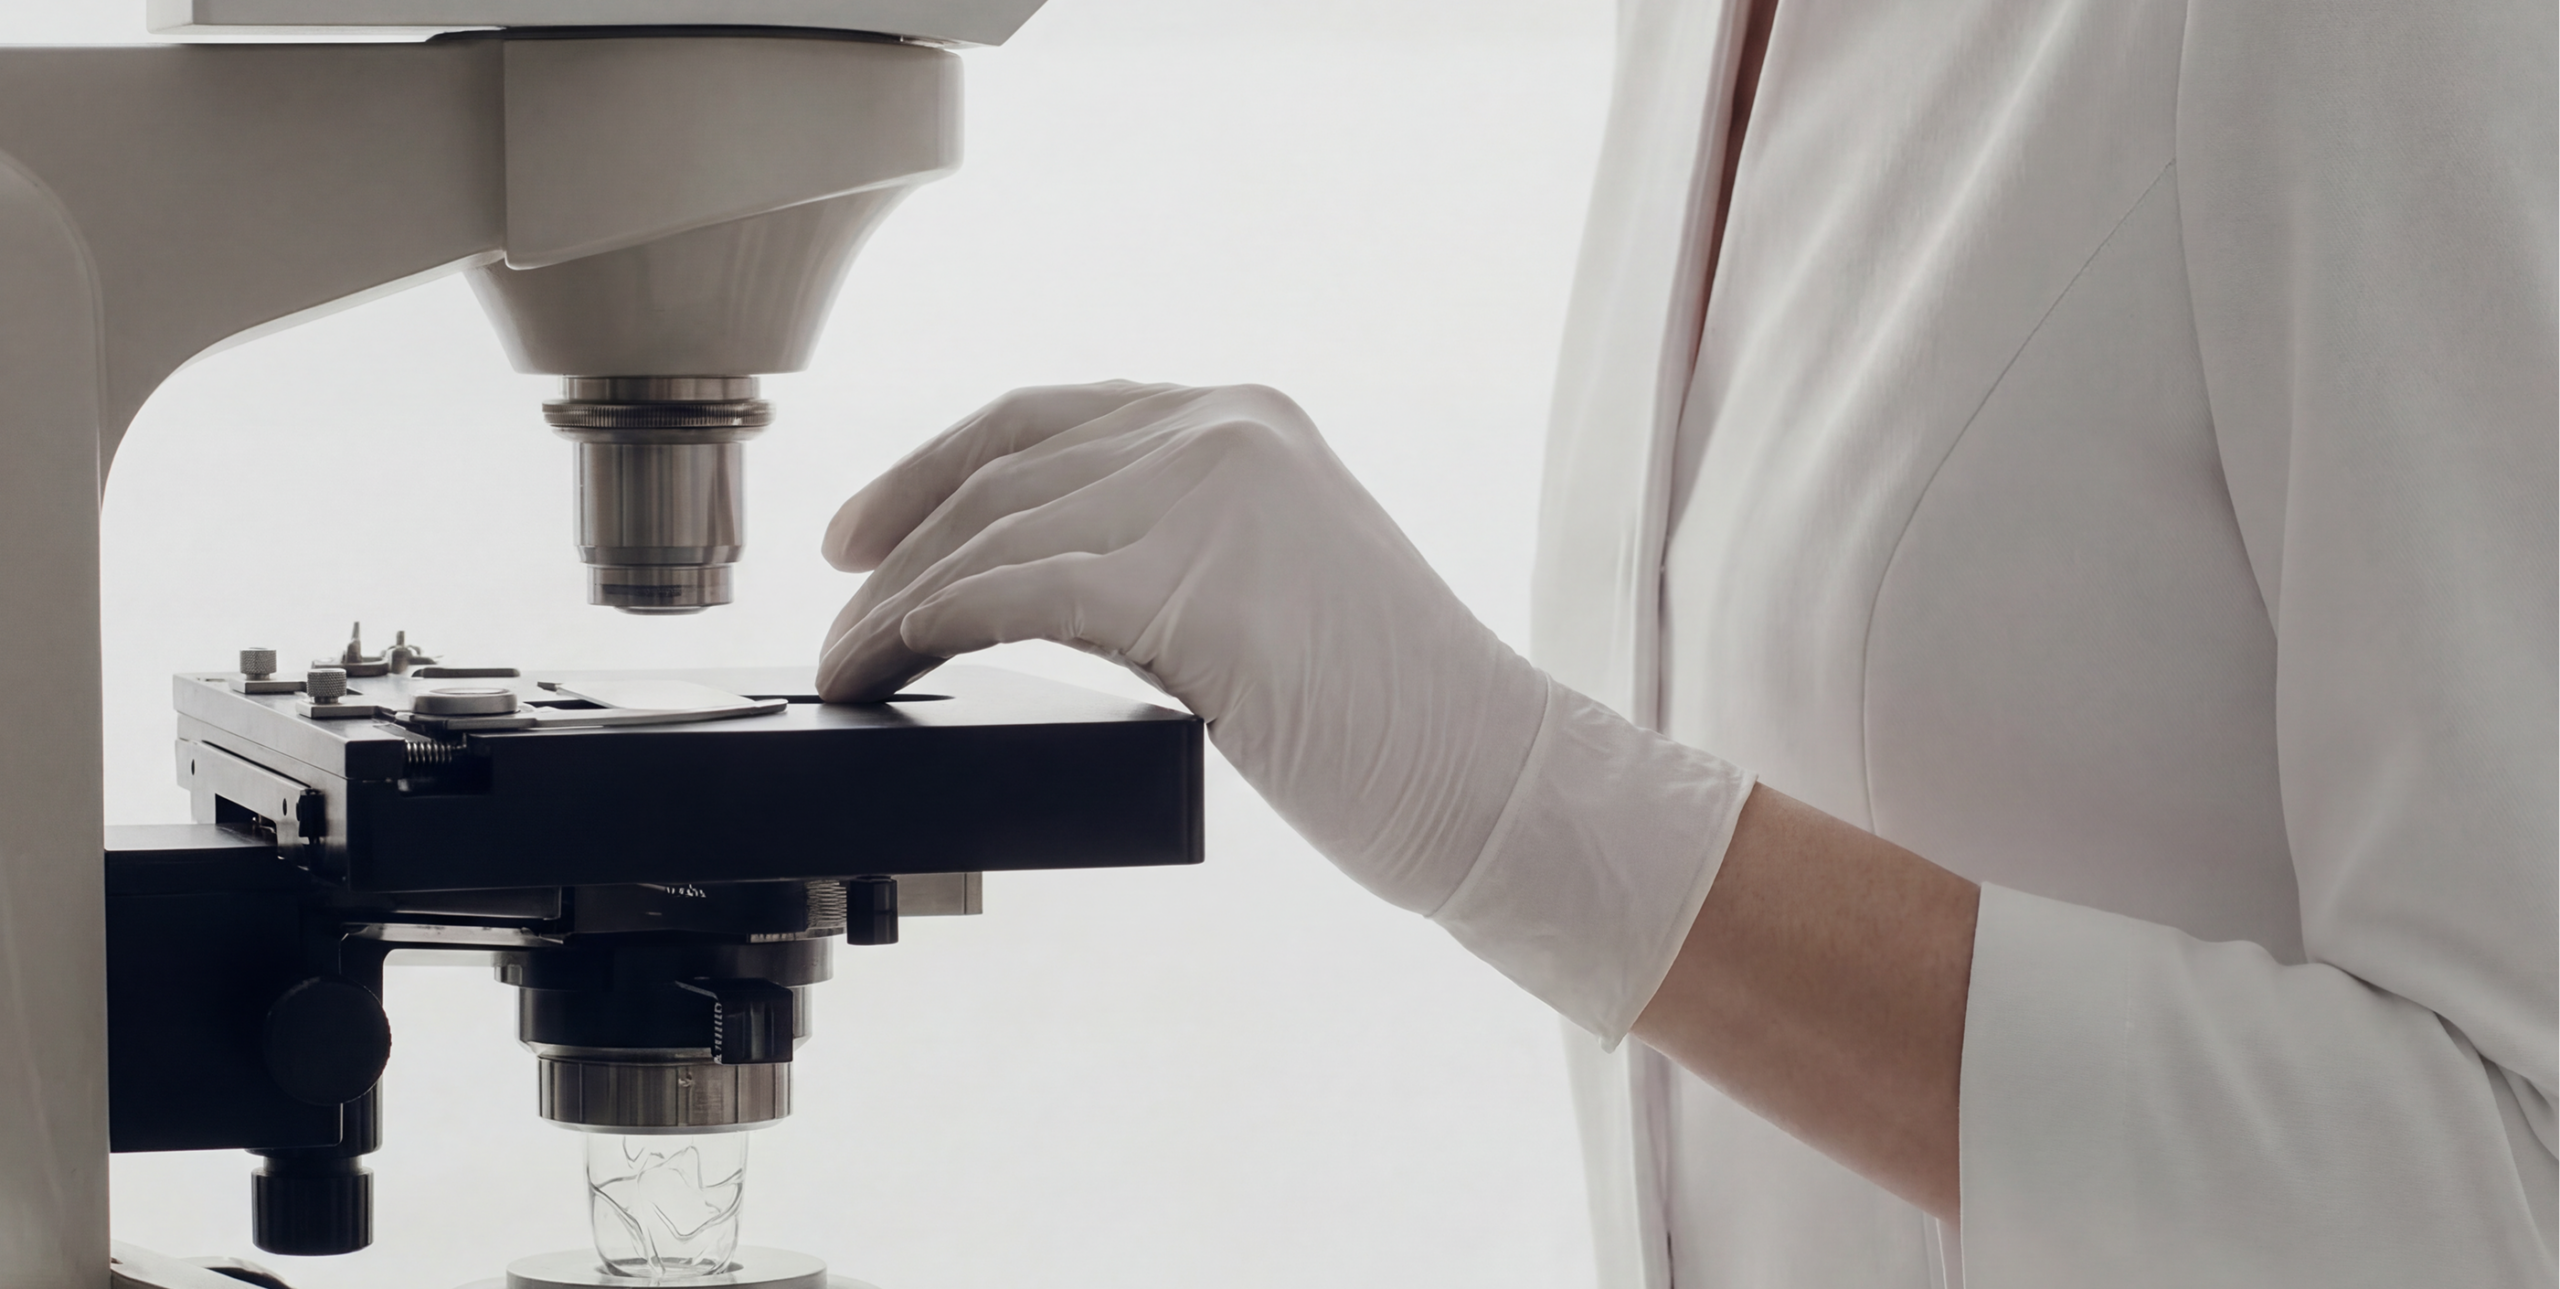
100,000 metagenomes processed in an accredited laboratory
Most providers are accredited for what happens in the lab. Microba is also accredited for what happens to the data after it leaves the bench.
Microba operates an ISO 15189 NATA-accredited laboratory with automated QC from sample receipt to data generation — anything outside predefined thresholds is flagged. 100,000+ metagenomes processed, every result a practitioner receives has been through the same rigorous process.
ISO 15189
Internationally recognised standard for medical laboratory processes — covering sample receipt, sequencing, and data generation
ISO 13485
Quality management system for software as a medical device — covering the bioinformatic analysis and interpretation pipeline
Shotgun metagenomics identifies species that other methods miss entirely
Shotgun metagenomics sequences all DNA from a faecal sample — not a single gene, not a predefined panel. The result is a comprehensive, unbiased view of the entire microbial community at species level (not genus level).7 That distinction matters clinically. Different species within the same genus can have very different roles in health, and without species-level resolution you’re working with an incomplete picture.
The Streptococcus example
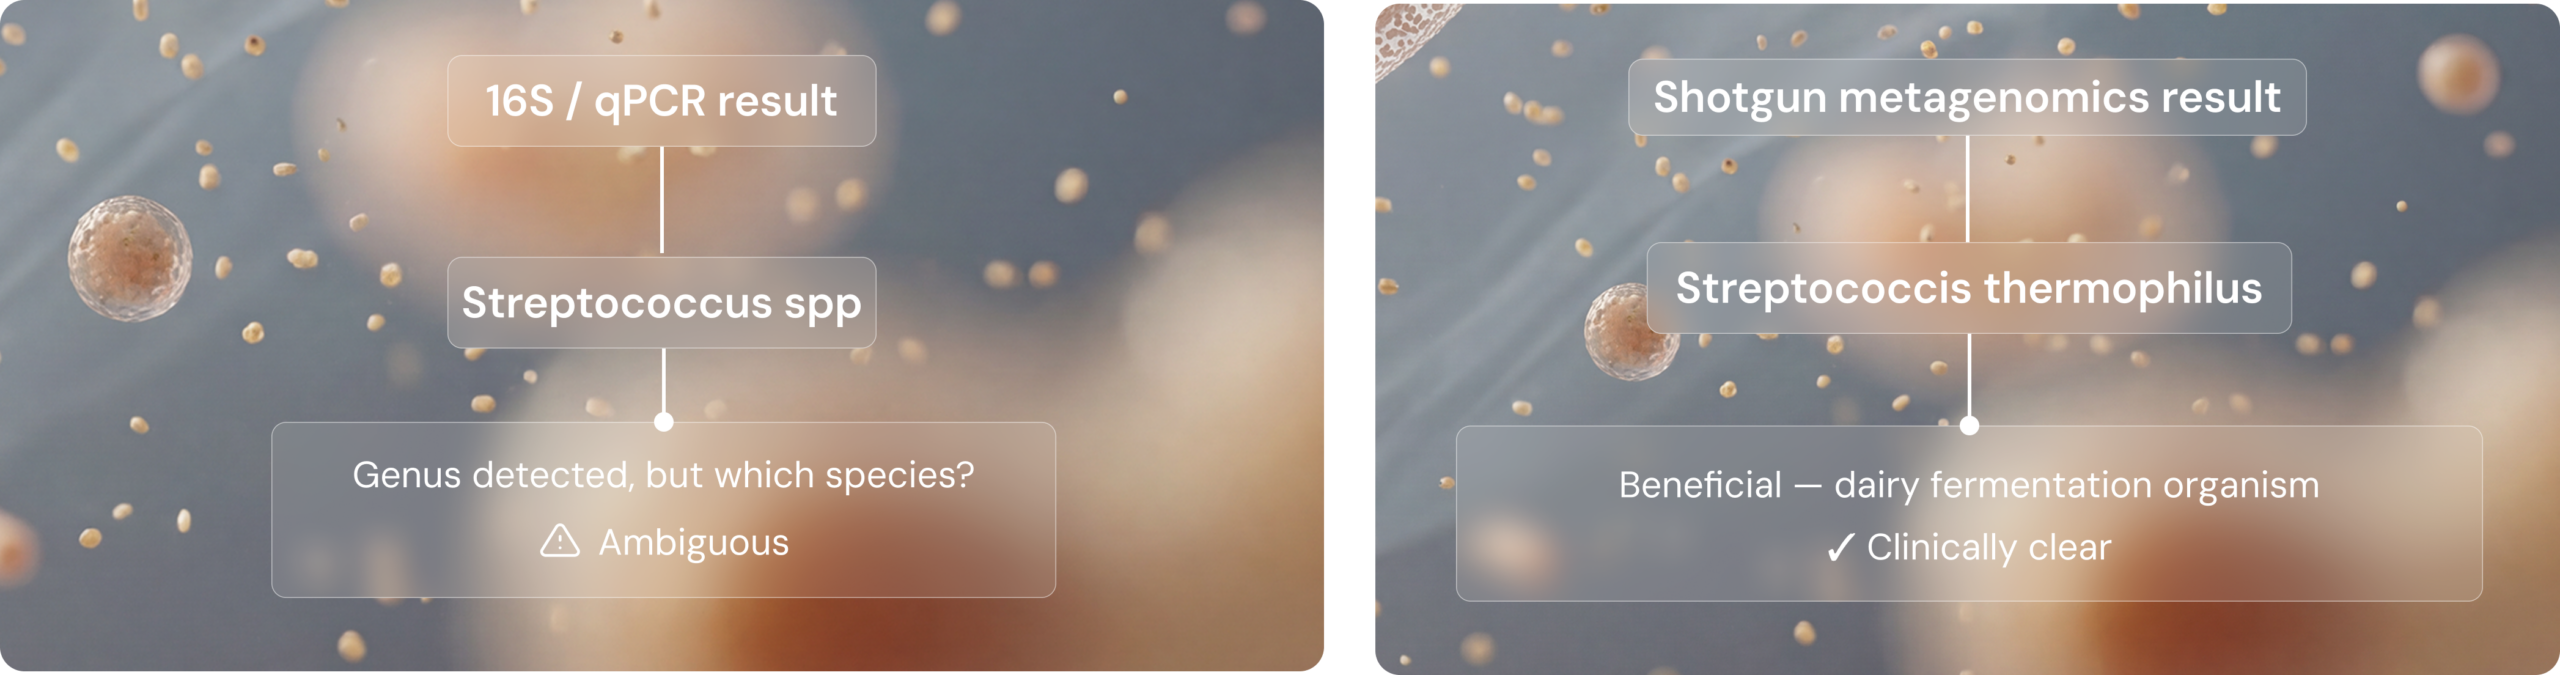
632 species vs 57
In a direct comparison, shotgun metagenomics identified 632 species in a sample where 16S rRNA gene sequencing detected only 578 — an order-of-magnitude difference in resolution that directly affects clinical utility.
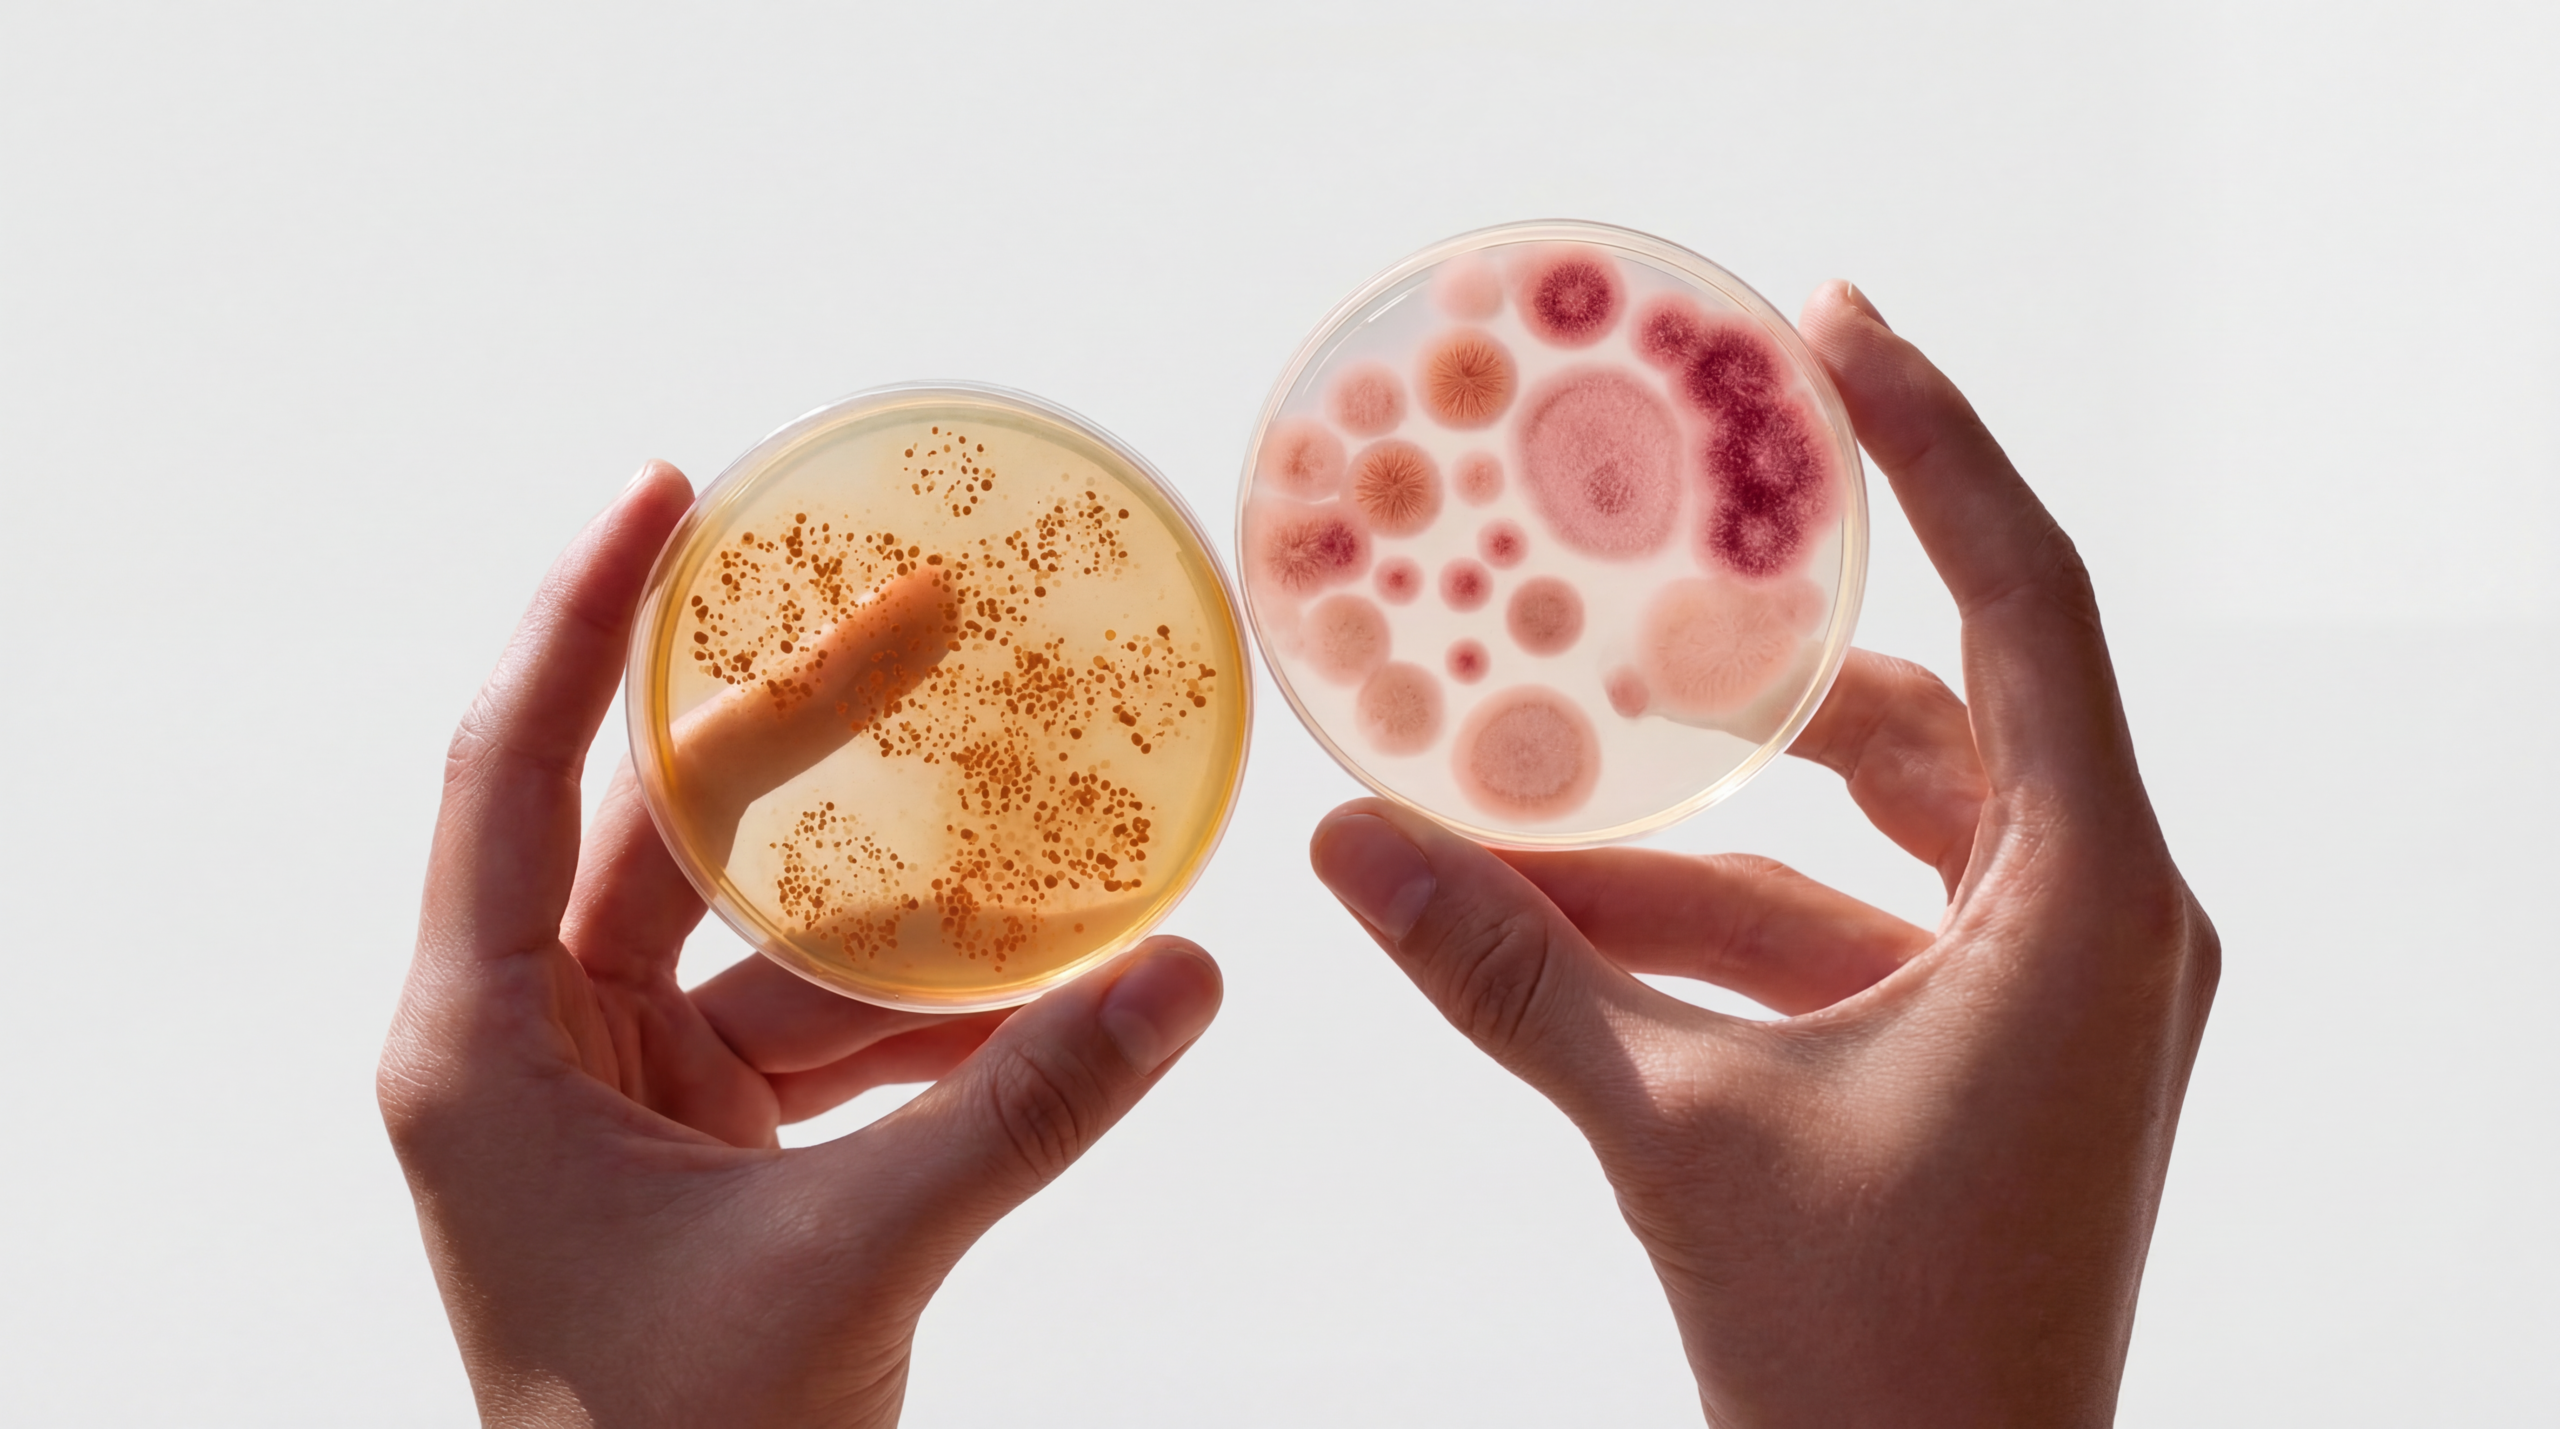
Comparison of microbiome testing methodologies
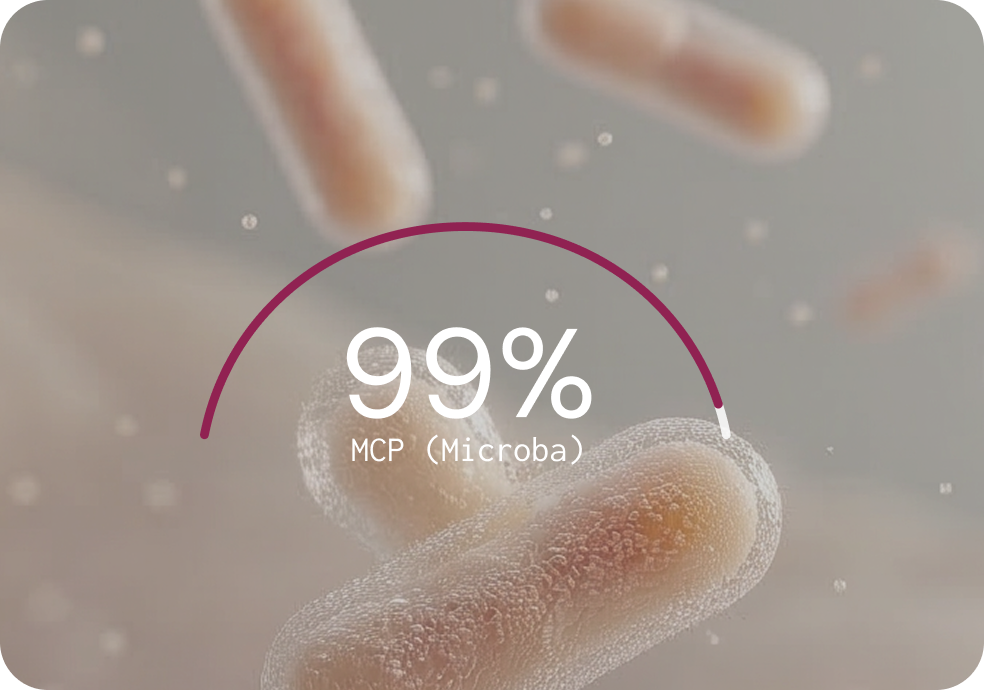
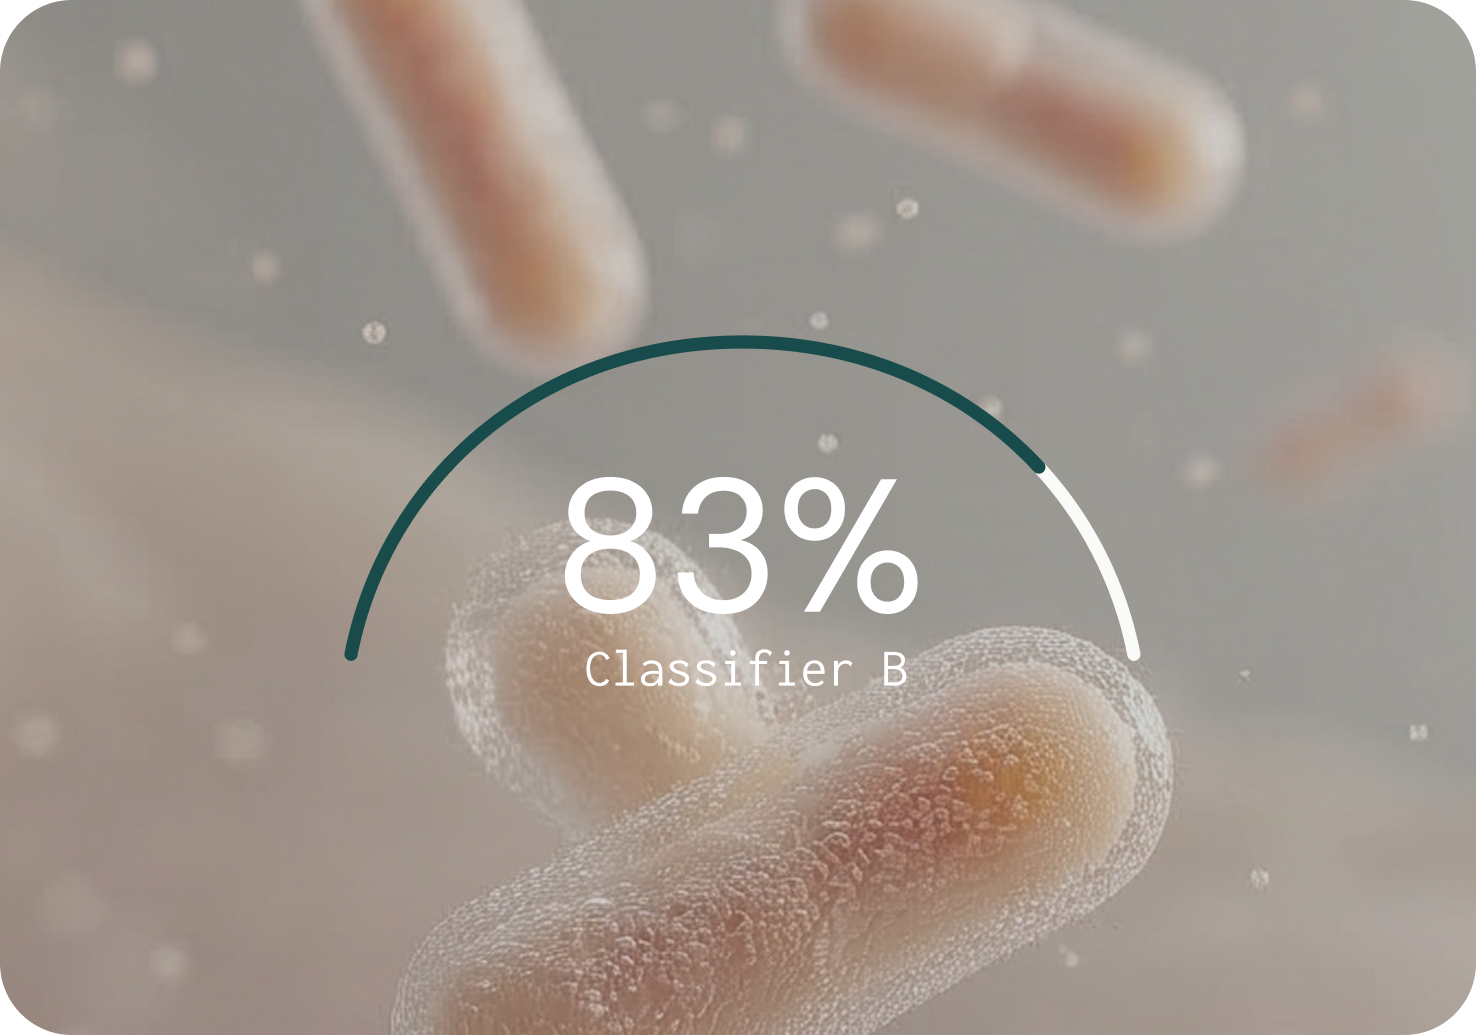
Species tell you who’s present. Function tells you what they’re doing.
Against nine widely used classifiers, MCP had the strongest overall performance
Generating sequence data is only the first step. The bioinformatic classifier determines what gets identified, what gets missed, and what gets falsely reported. Microba's Community Profiler (MCP) was benchmarked against nine other classifiers across 140 simulated microbial communities in a peer-reviewed study.5 The benchmarking results highlight the difference.

Three integrated layers translate microbial presence into clinical meaning
Separately, each layer is informative. Together they deliver something no single method can. Microba’s Microbiome Explorer combines three layers of information to connect what’s present in the microbiome with measurable clinical markers of gut function and inflammation.
PATHOGEN DETECTION
A panel of 13 common bacterial pathogens and five parasites detected via CE-certified multiplex PCR assays.
HUMAN STOOL MARKERS
Six GI health markers including calprotectin, lactoferrin, faecal occult blood, secretory IgA, pancreatic elastase, and zonulin — assessed using CE-certified immunohistochemistry assays. Faecal pH is also measured as an investigative marker for research use only.
MICROBIOME PROFILING
Species-level profiling of 28,000+ species including microbial diversity, richness, and 16 health-associated functional markers — such as butyrate production, trimethylamine, hexa-acylated lipopolysaccharides, mucin degradation, and oxalate consumption. For research use only.
Reported markers are clinically relevant and evidence-backed
Not every microbial signal is clinically meaningful. Microba applies a rigorous three-tier scientific curation framework – only markers that are both evidence-backed and clinically relevant are included in the report.* Practitioners can be confident that everything reported has a reason to be there. Here’s the standard every marker is held to:
Tier 1 Plausible mechanism of action
In-vitro or in-vivo data must demonstrate why the microbial marker is biologically connected to the relevant health category.
Tier 2 Reproducible human associations
At least two peer-reviewed human studies must show a direct or indirect link between the marker and the health outcome.
Tier 3 Significant associations in Microba’s dataset
The marker must show a statistically significant association in Microba’s own database of 19,000+ consented patient profiles, controlled for age, sex, BMI, and bowel habits.
Read the full methodology behind our test.
A rigorously defined reference group of 450+ individuals removes technical bias from every result
Results are only meaningful when compared against the right baseline. Many commercially available tests either provide no details about their reference cohort, use publicly available microbiome data, or compare samples against their entire database regardless of health status. Microba’s cohort of more than 450 individuals meet strict health inclusion criteria – and all reference samples were collected and processed using the same workflow as patient samples, eliminating a significant source of technical bias
The Microba’s healthy reference group
Carefully selected to include more than 450 individuals meeting strict inclusion criteria. Critically, all reference samples were collected and processed using exactly the same workflow as patient test samples, eliminating a common source of technical bias.
INCLUSION CRITERIA
No major medical conditions
No or minimal GI symptoms· Mild or lower stress, anxiety, and depression
BMI below 30 Daily fruit and vegetable intake
Low to moderate alcohol consumption
The report tells you what’s there. Evidence-graded actions tell you what to do about it.
Microbial markers and gastrointestinal markers are organised into six health categories that map to recognisable clinical concepts. Where a marker falls outside the healthy reference range, the report provides evidence-graded possible actions – reviewed against the available scientific evidence and graded using the NHMRC evidence grading framework. The result is a report that doesn’t just tell you what’s there; it also helps identify which dietary, supplement, or lifestyle interventions are most strongly supported by the evidence.
Worked example: Mucin degradation and intestinal inflammation
Mechanism: When dietary fibre is insufficient, mucin-degrading microbes can consume the protective mucus layer lining the gut, increasing microbial contact with the intestinal epithelium and triggering immune activation.
Human associations: A cross-sectional study of more than 1,000 individuals found a significant positive association between mucin-degrading pathway abundance and faecal calprotectin.⁸ Elevated mucin degrading pathways have also been observed in colorectal cancer cohorts.⁹,¹⁰
Internal validation: In Microba’s dataset, mucin-degrading species are significantly increased in conditions related to intestinal inflammation.
What sets Microba’s approach apart
not 16S or qPCR
benchmarked bioinformatics
evidence curation
reference group
Download the print ready version
Save a print-ready version of the guide for easy access anytime.
.*The microbiome component of Microba Microbiome Explorer is for research use only and is not a diagnostic tool. Microbiome results should be interpreted by qualified healthcare practitioners in the context of a patient’s clinical history, symptoms, and other diagnostic findings.
References
1.Lynch, S. V. & Pedersen, O. The human intestinal microbiome in health and disease. N. Engl. J. Med. 375, 2369–2379 (2016). https://doi.org/10.1056/NEJMra1600266
2. Gilbert, J. A., Blaser, M. J., Caporaso, J. G., Jansson, J. K., Lynch, S. V. & Knight, R. Current understanding of the human microbiome. Nat. Med. 24, 392–400 (2018). https://doi.org/10.1038/nm.4517
3. Fan, Y. & Pedersen, O. Gut microbiota in human metabolic health and disease. Nat. Rev. Microbiol. 19, 55–71 (2021). https://doi.org/10.1038/s41579-020-0433-9
4. Zmora, N., Suez, J. & Elinav, E. You are what you eat: diet, health and the gut microbiota. Nat. Rev. Gastroenterol. Hepatol. 16, 35–56 (2019). https://doi.org/10.1038/s41575-018-0061-2
5. Parks, D. H., Rigato, F., Vera-Wolf, P., Krause, L., Hugenholtz, P., Tyson, G. W. & Wood, D. L. A. Evaluation of the Microba Community Profiler for taxonomic profiling of metagenomic datasets from the human gut microbiome. Front. Microbiol. 12, 643682 (2021). https://doi.org/10.3389/fmicb.2021.643682
6. Pribyl, A. L. et al. Critical evaluation of faecal microbiome preservation using metagenomic analysis. ISME Commun. 1, 14 (2021). https://doi.org/10.1038/s43705-021-00014-2
7. Hugenholtz, P. & Tyson, G. W. Metagenomics. Nature 455, 481–483 (2008). https://doi.org/10.1038/455481a
8. Zhernakova, A., Kurilshikov, A., Bonder, M. J., Tigchelaar, E. F., Schirmer, M., Vatanen, T. et al. Population-based metagenomics analysis reveals markers for gut microbiome composition and diversity. Science 352, 565–569 (2016). https://doi.org/10.1126/science.aad3369
9. Thomas, A. M., Manghi, P., Asnicar, F., Pasolli, E., Armanini, F., Zolfo, M. et al. Metagenomic analysis of colorectal cancer datasets identifies cross-cohort microbial diagnostic signatures and a link with choline degradation. Nat. Med. 25, 667–678 (2019). https://doi.org/10.1038/s41591-019-0405-7
10. Wirbel, J., Pyl, P. T., Karber, E., Zych, K., Kashani, A., Milanese, A. et al. Meta-analysis of fecal metagenomes reveals global microbial signatures that are specific for colorectal cancer. Nat. Med. 25, 679–689 (2019). https://doi.org/10.1038/s41591-019-0406-6